

Your dashboard
The state of your equipment, as soon as you log in.
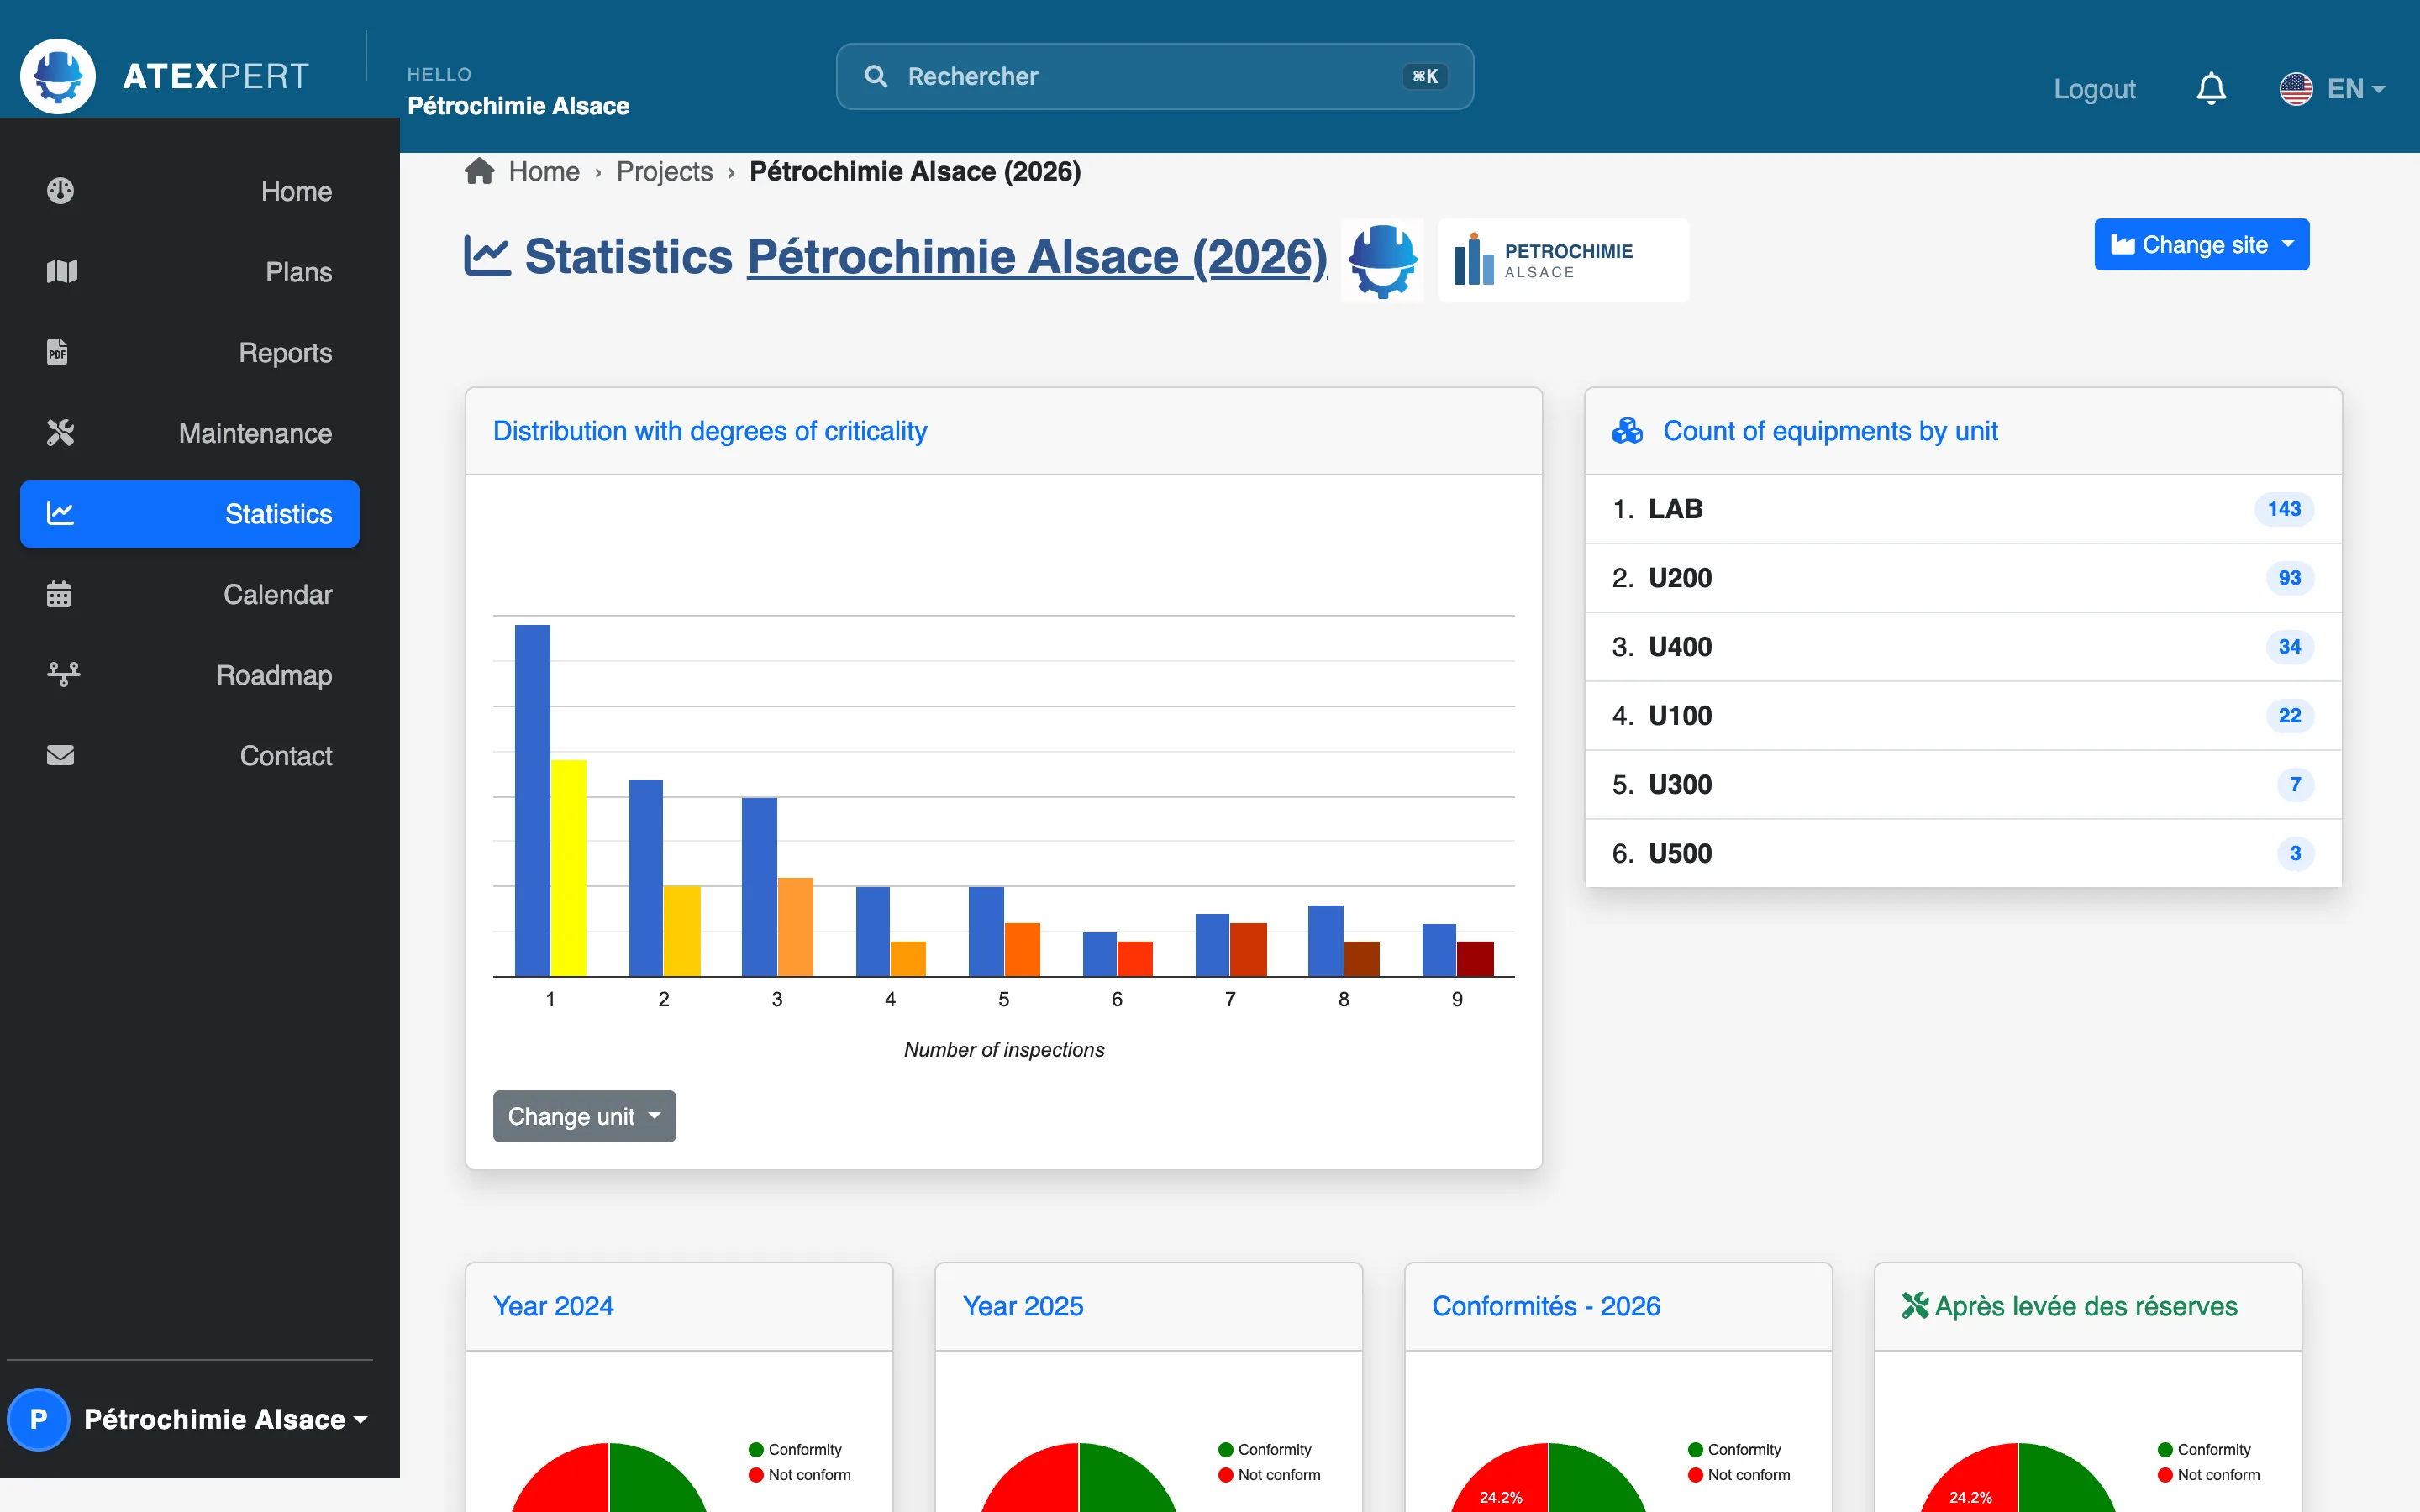
Number of items tracked, progress of the current campaign, breakdown of findings by criticality and by unit. You know where you stand without opening a single file.
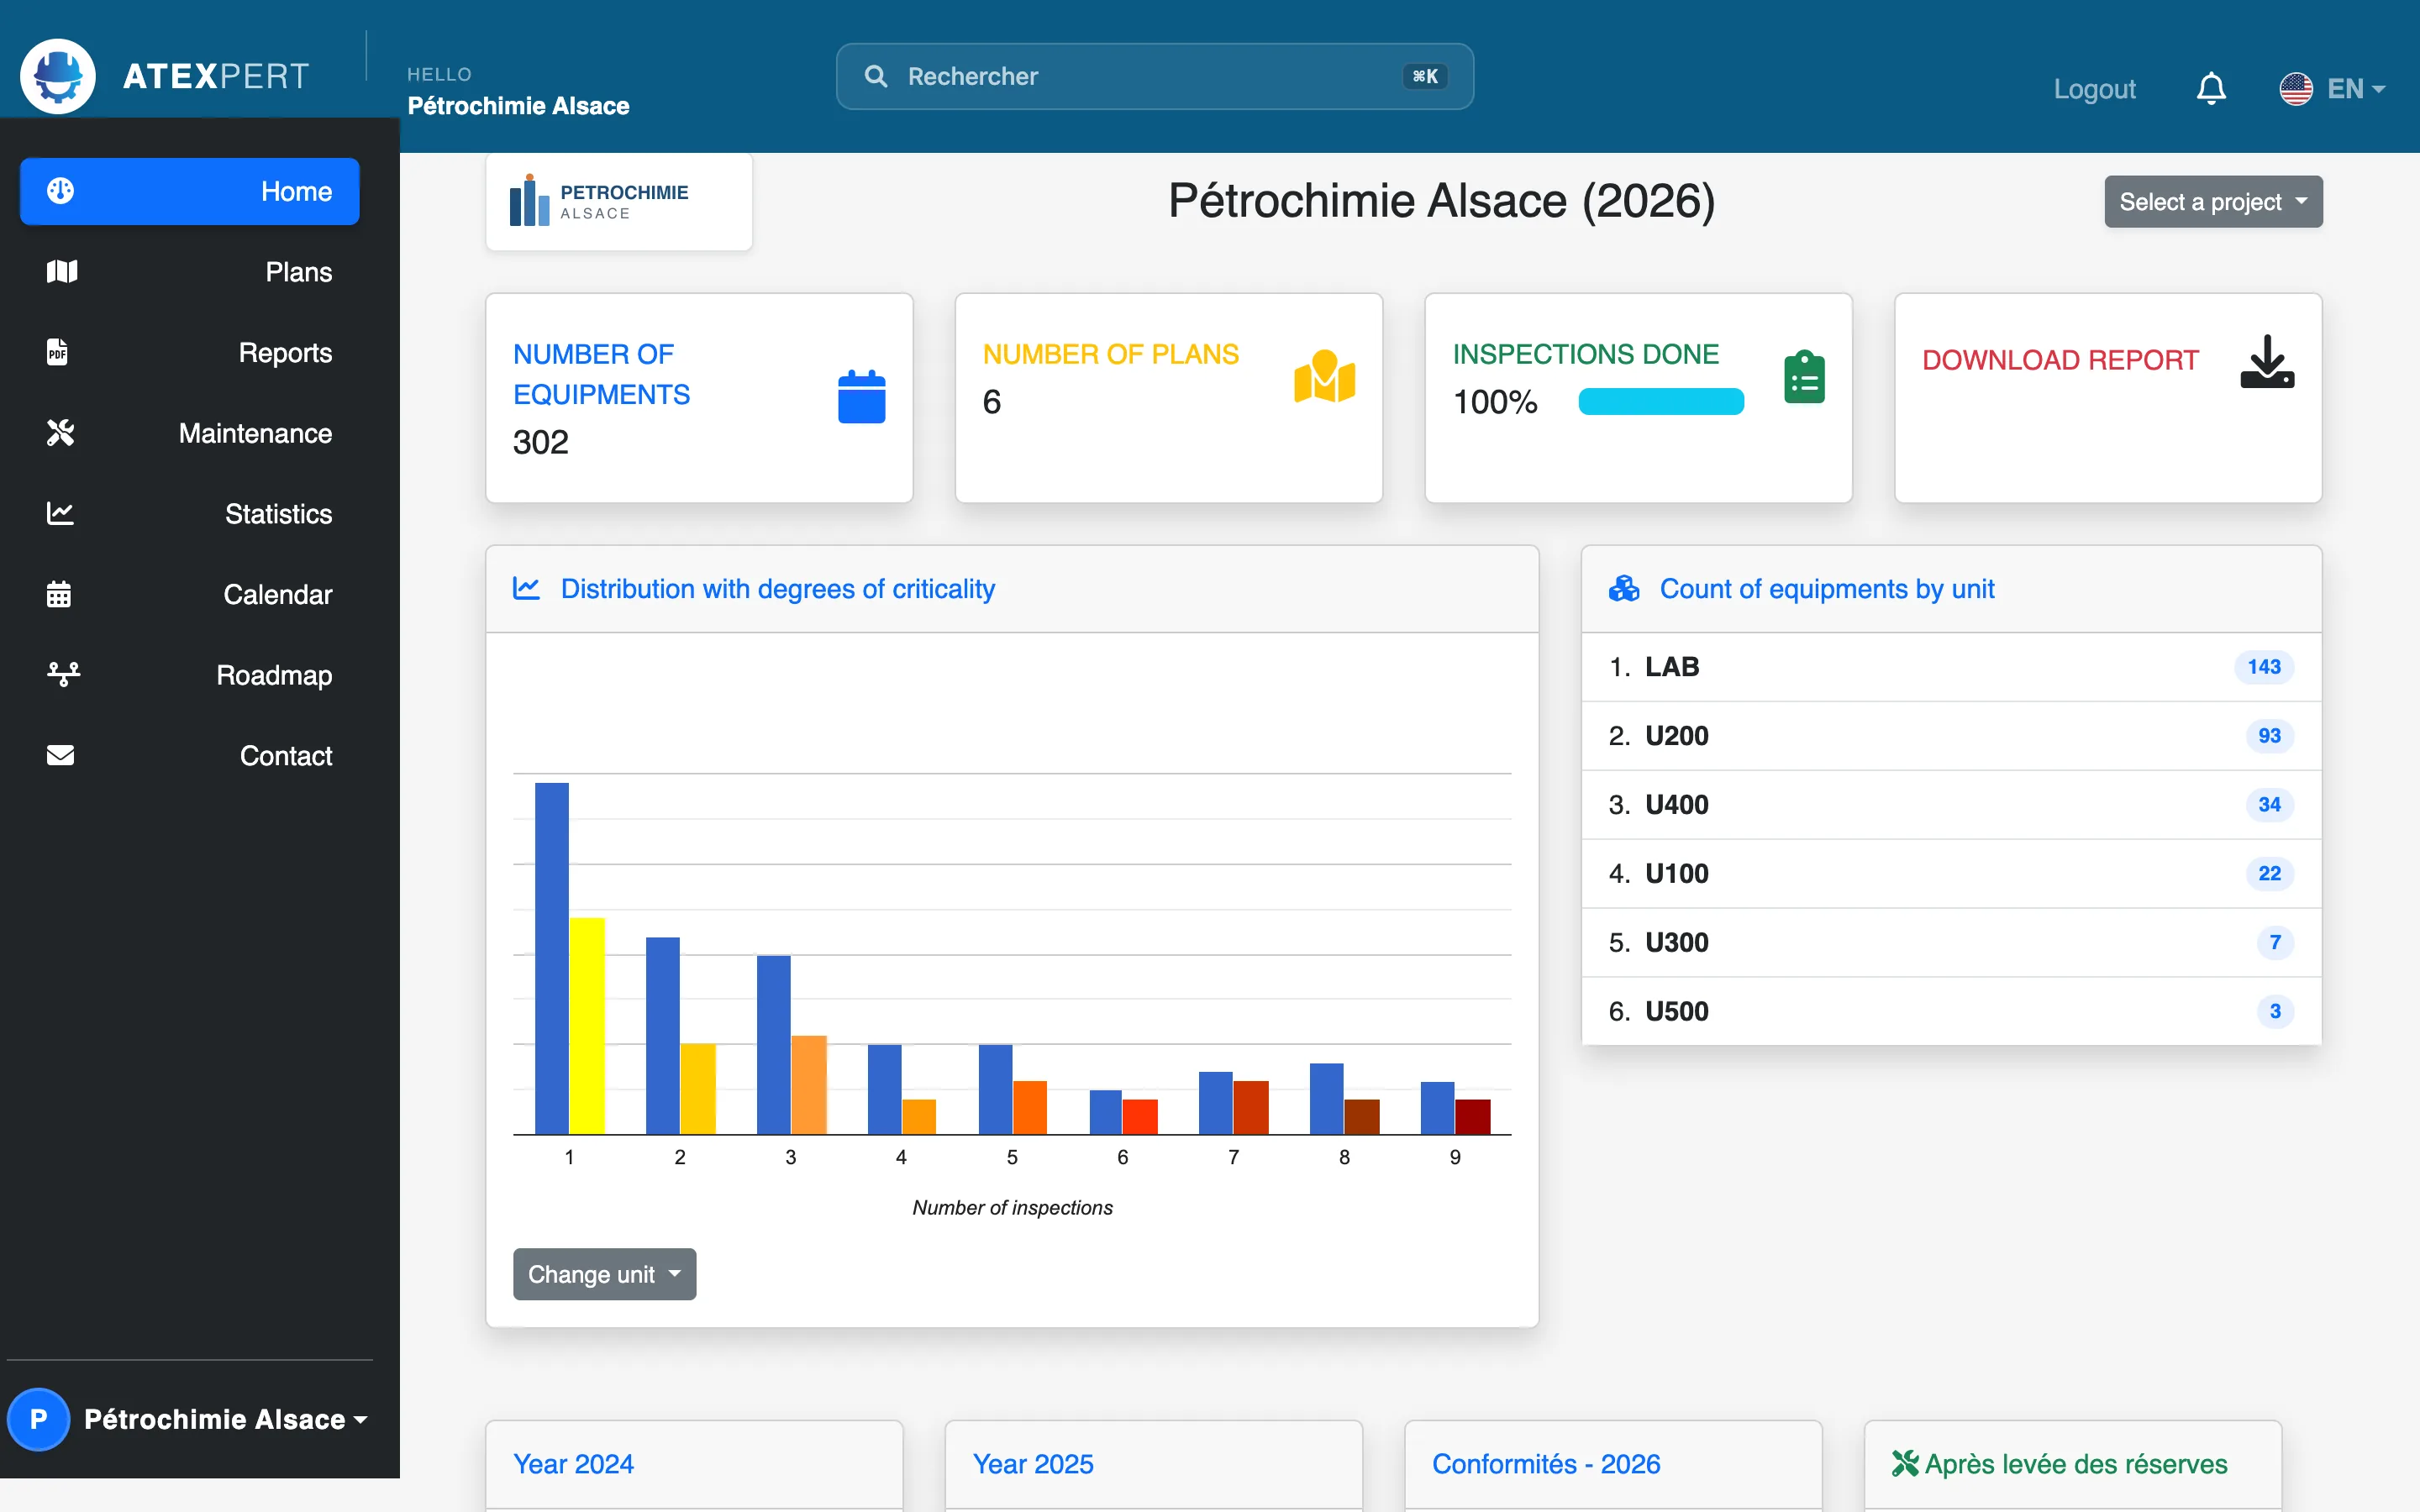
The state of your equipment, as soon as you log in.
Number of items tracked, progress of the current campaign, breakdown of findings by criticality and by unit. You know where you stand without opening a single file.
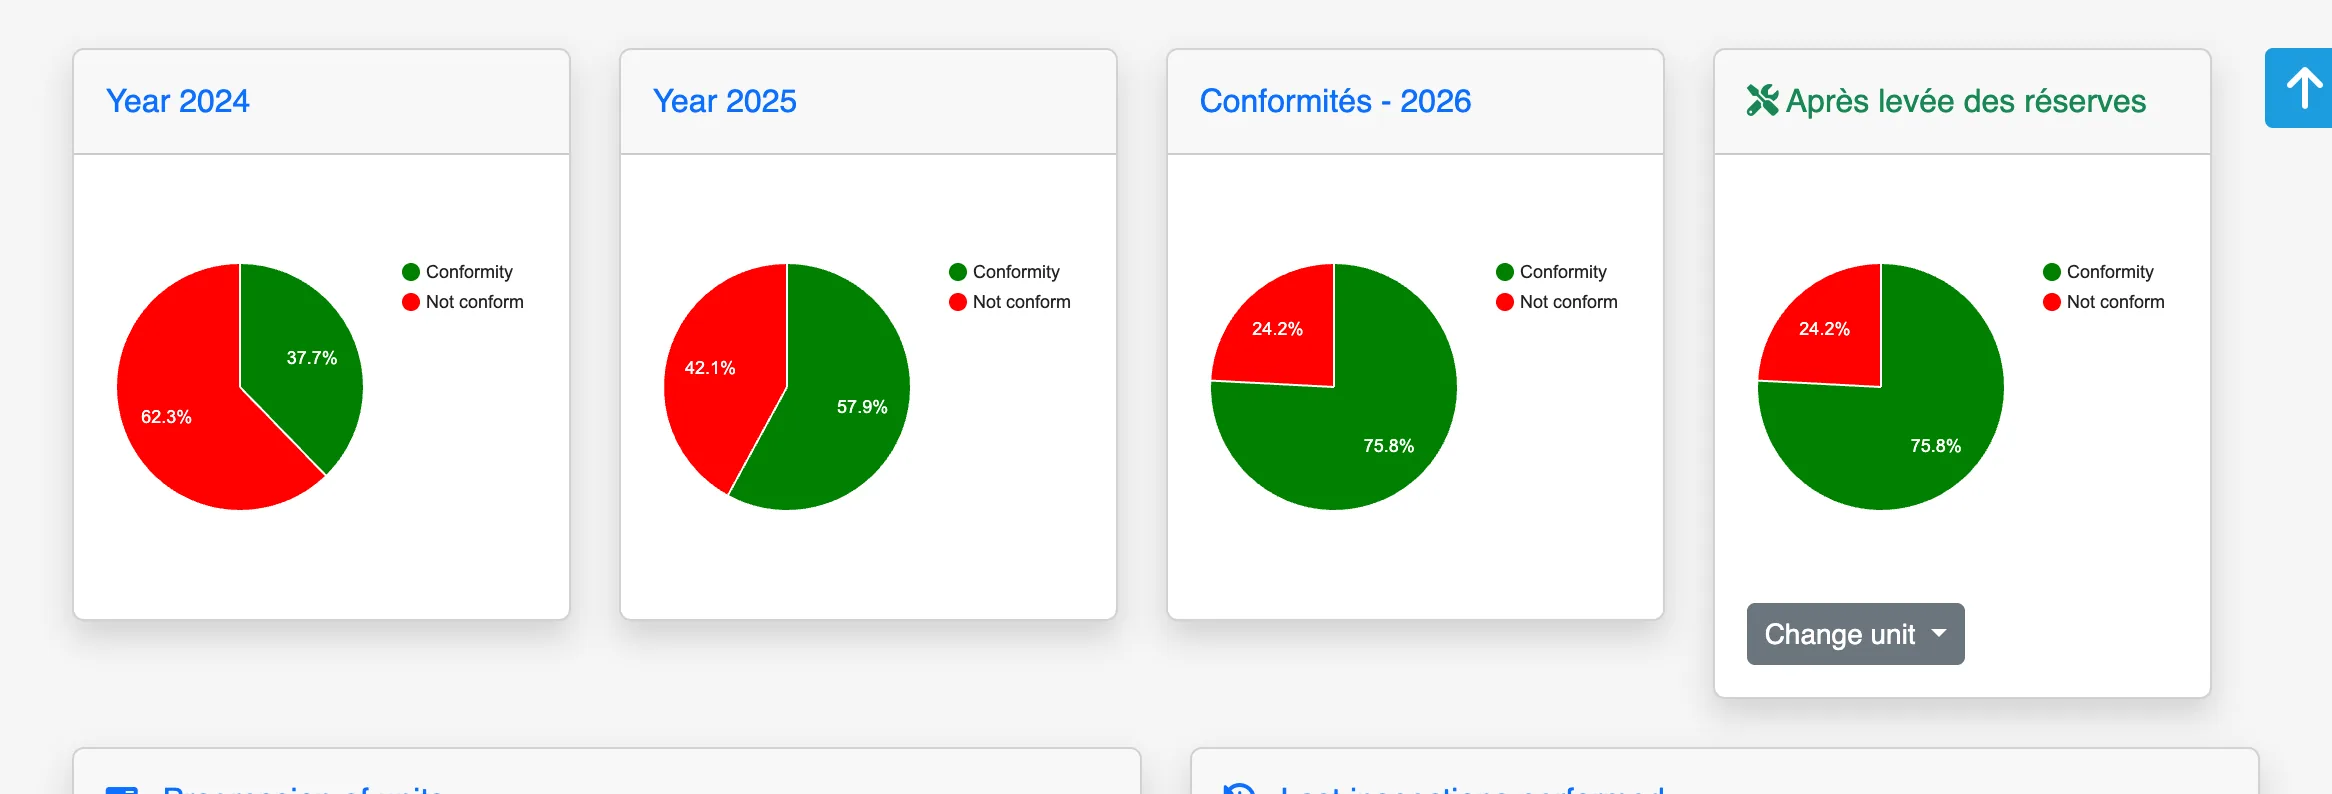
The current campaign, next to the two before it.
Each campaign is linked to the previous one, so you immediately see whether findings have been closed: 62 % non compliant in 2024, 42 % in 2025, 24 % in 2026. That is the figure you show your management and your inspectorate.
Your past campaigns do not have to stay in a spreadsheet.
Earlier years are imported from the Excel or CSV files you already hold: one row per item, with its tag, description, manufacturer, hazardous area classification and marking. Each row becomes a complete record, attached to the right year, and links to the campaigns that follow — which is what feeds the N / N-1 / N-2 comparison. Your history stops being a workbook passed around by email: it is kept in one place, open to all your teams, backed up and still accessible years later.
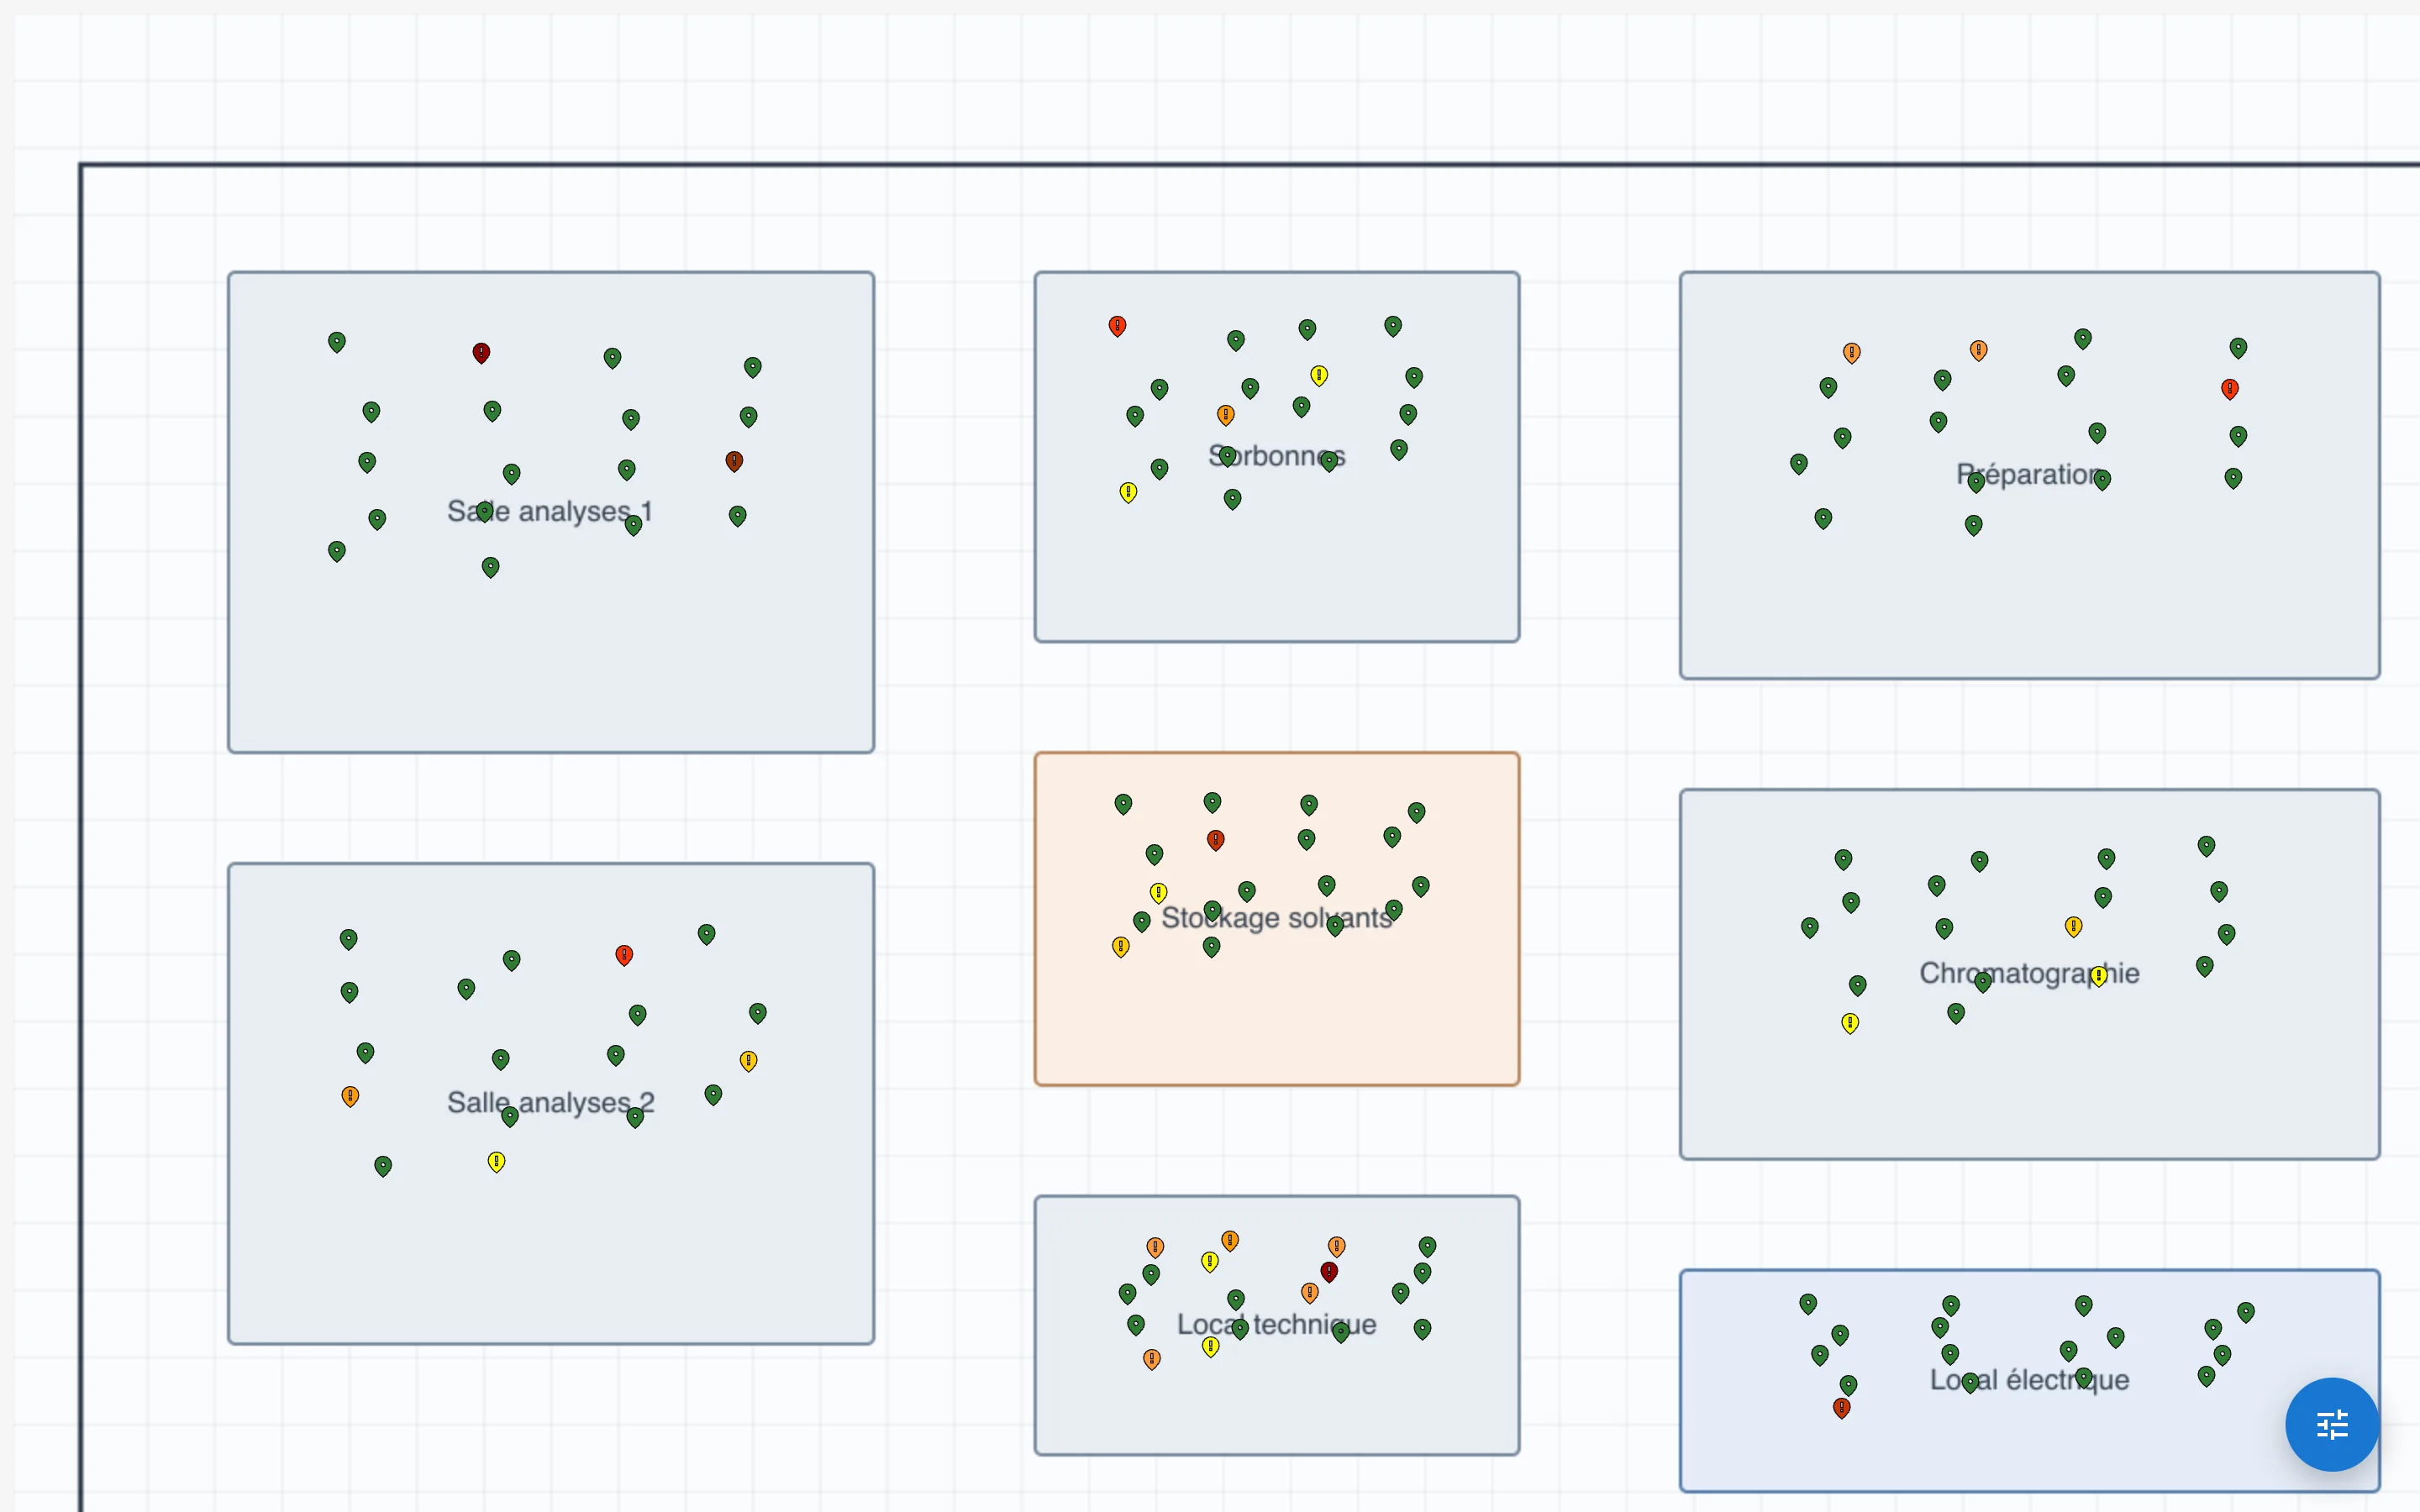
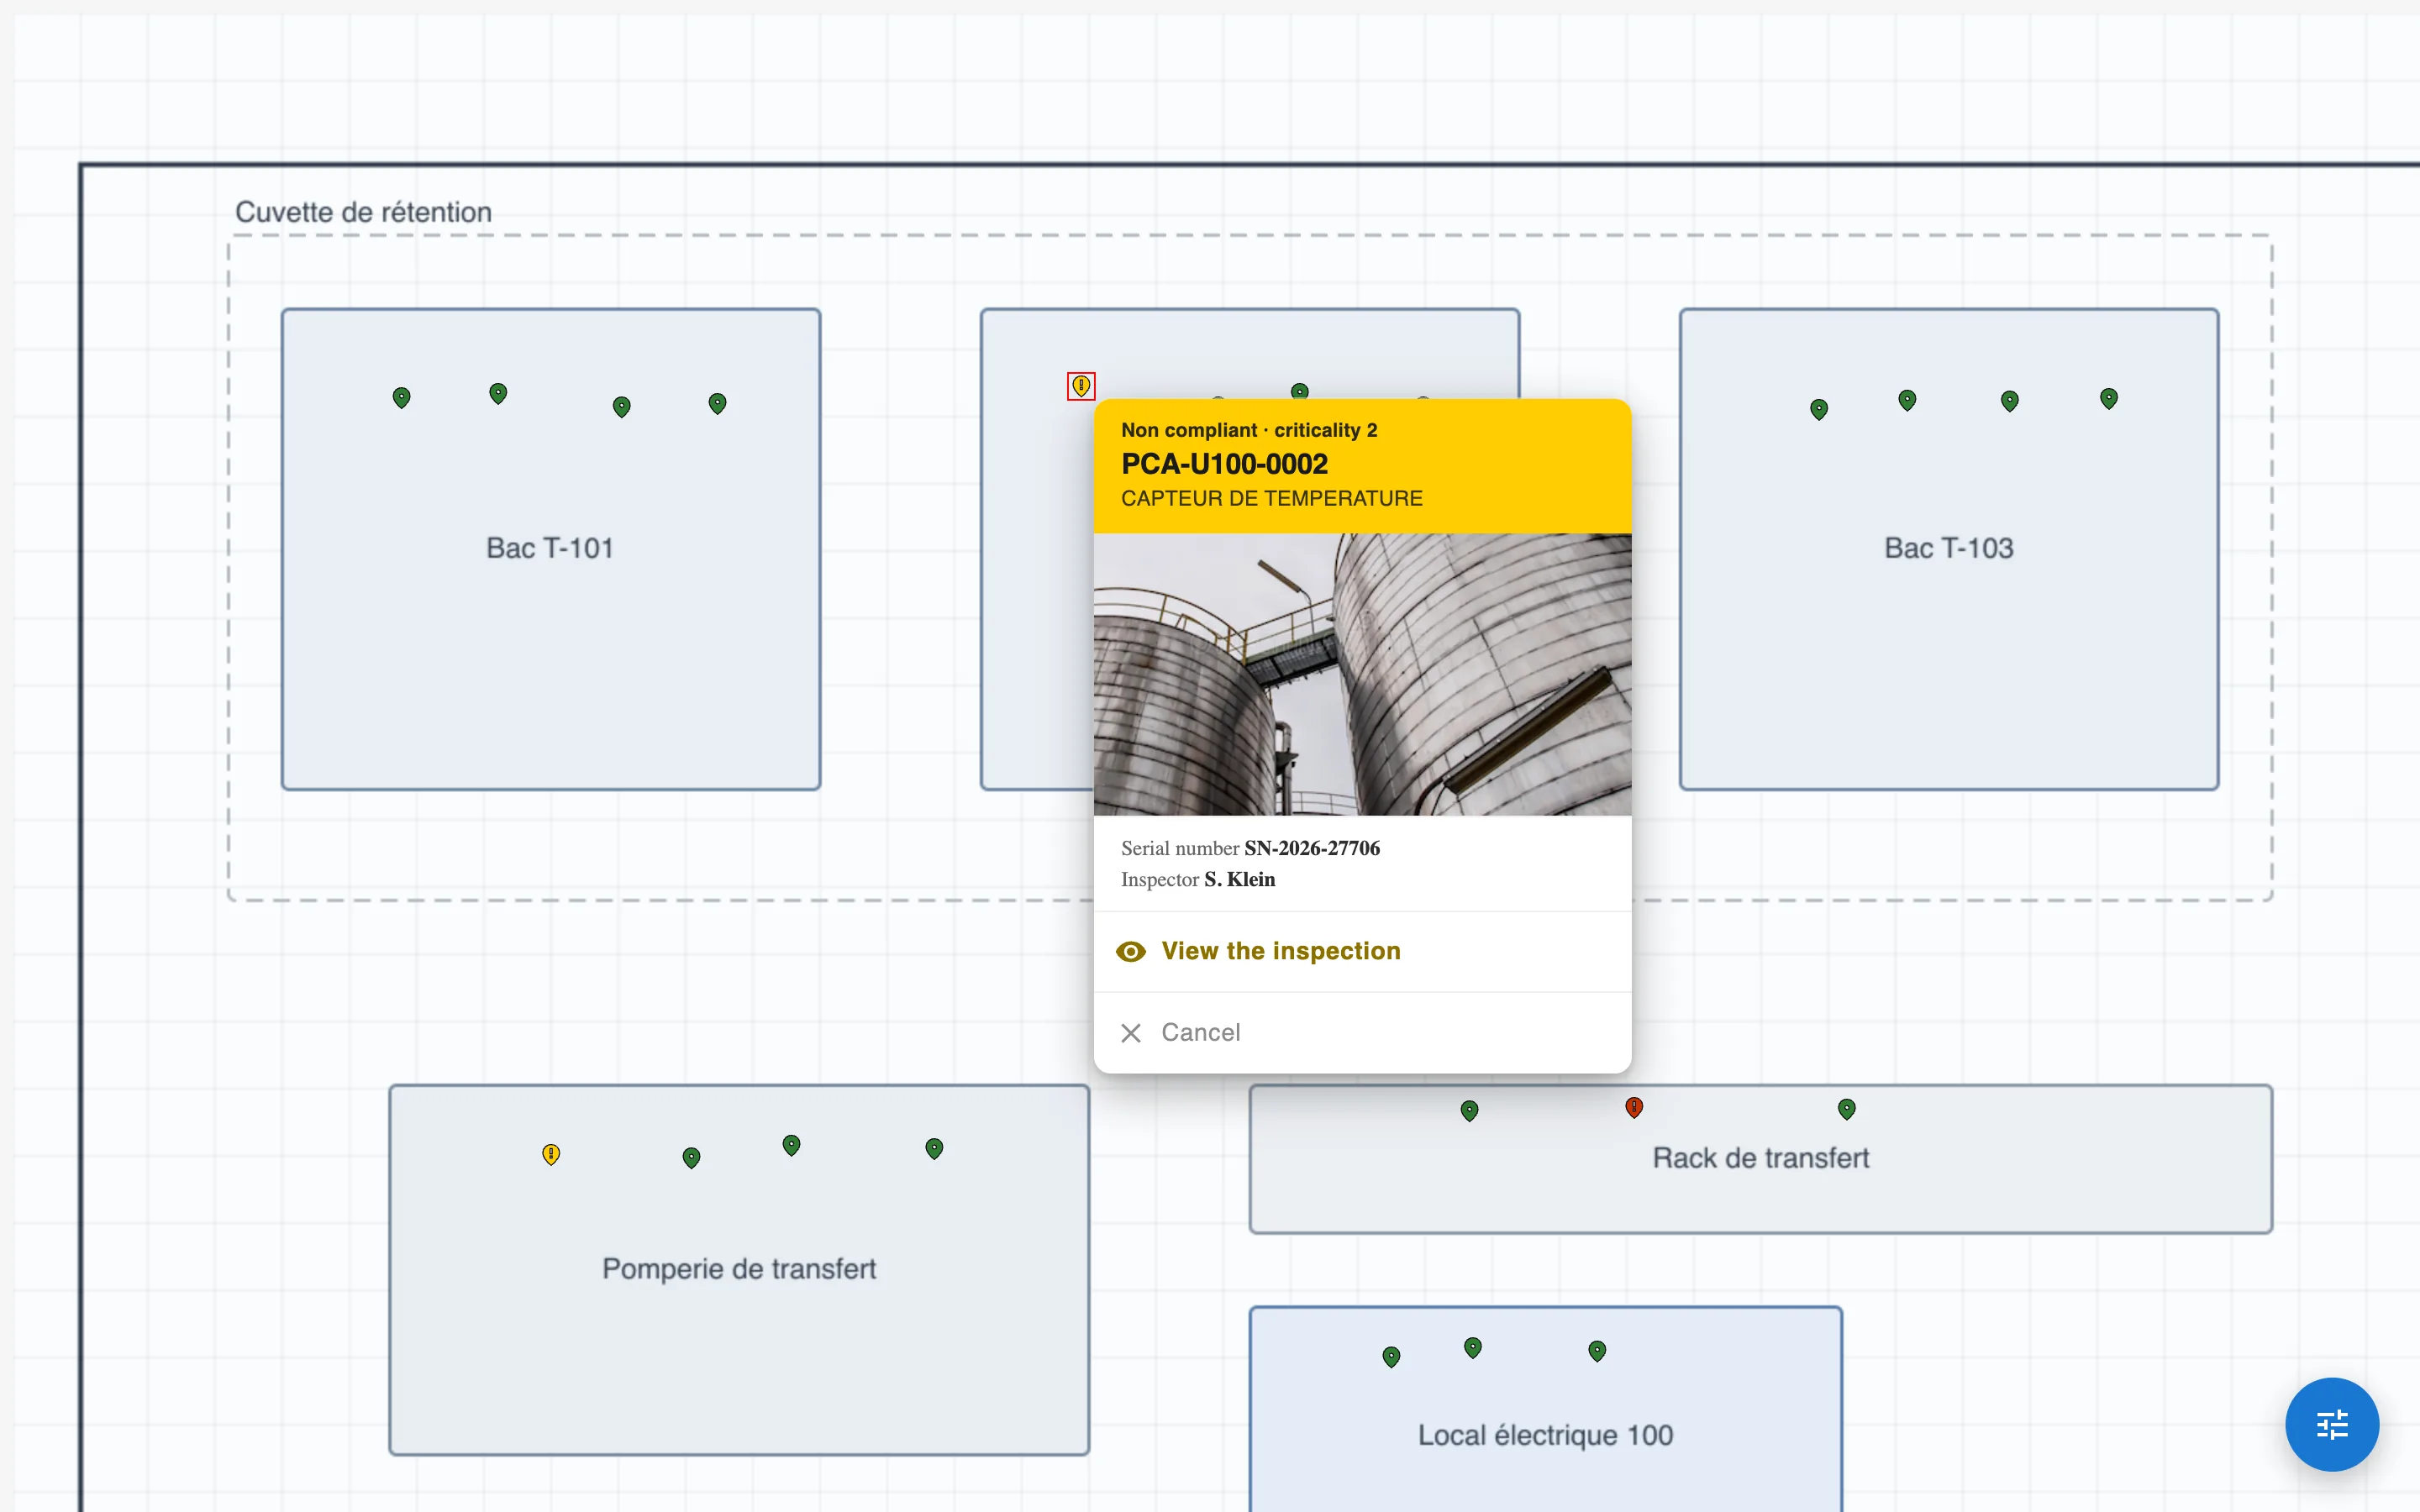
Every item is placed where it actually stands.
Your unit drawings carry the inspection points, coloured by status. Locating a finding takes one glance: which building, which room, which rack. No more matching a spreadsheet against a paper drawing. Clicking a point opens its card: the photograph taken on site, the tag, the compliance status and the inspector.
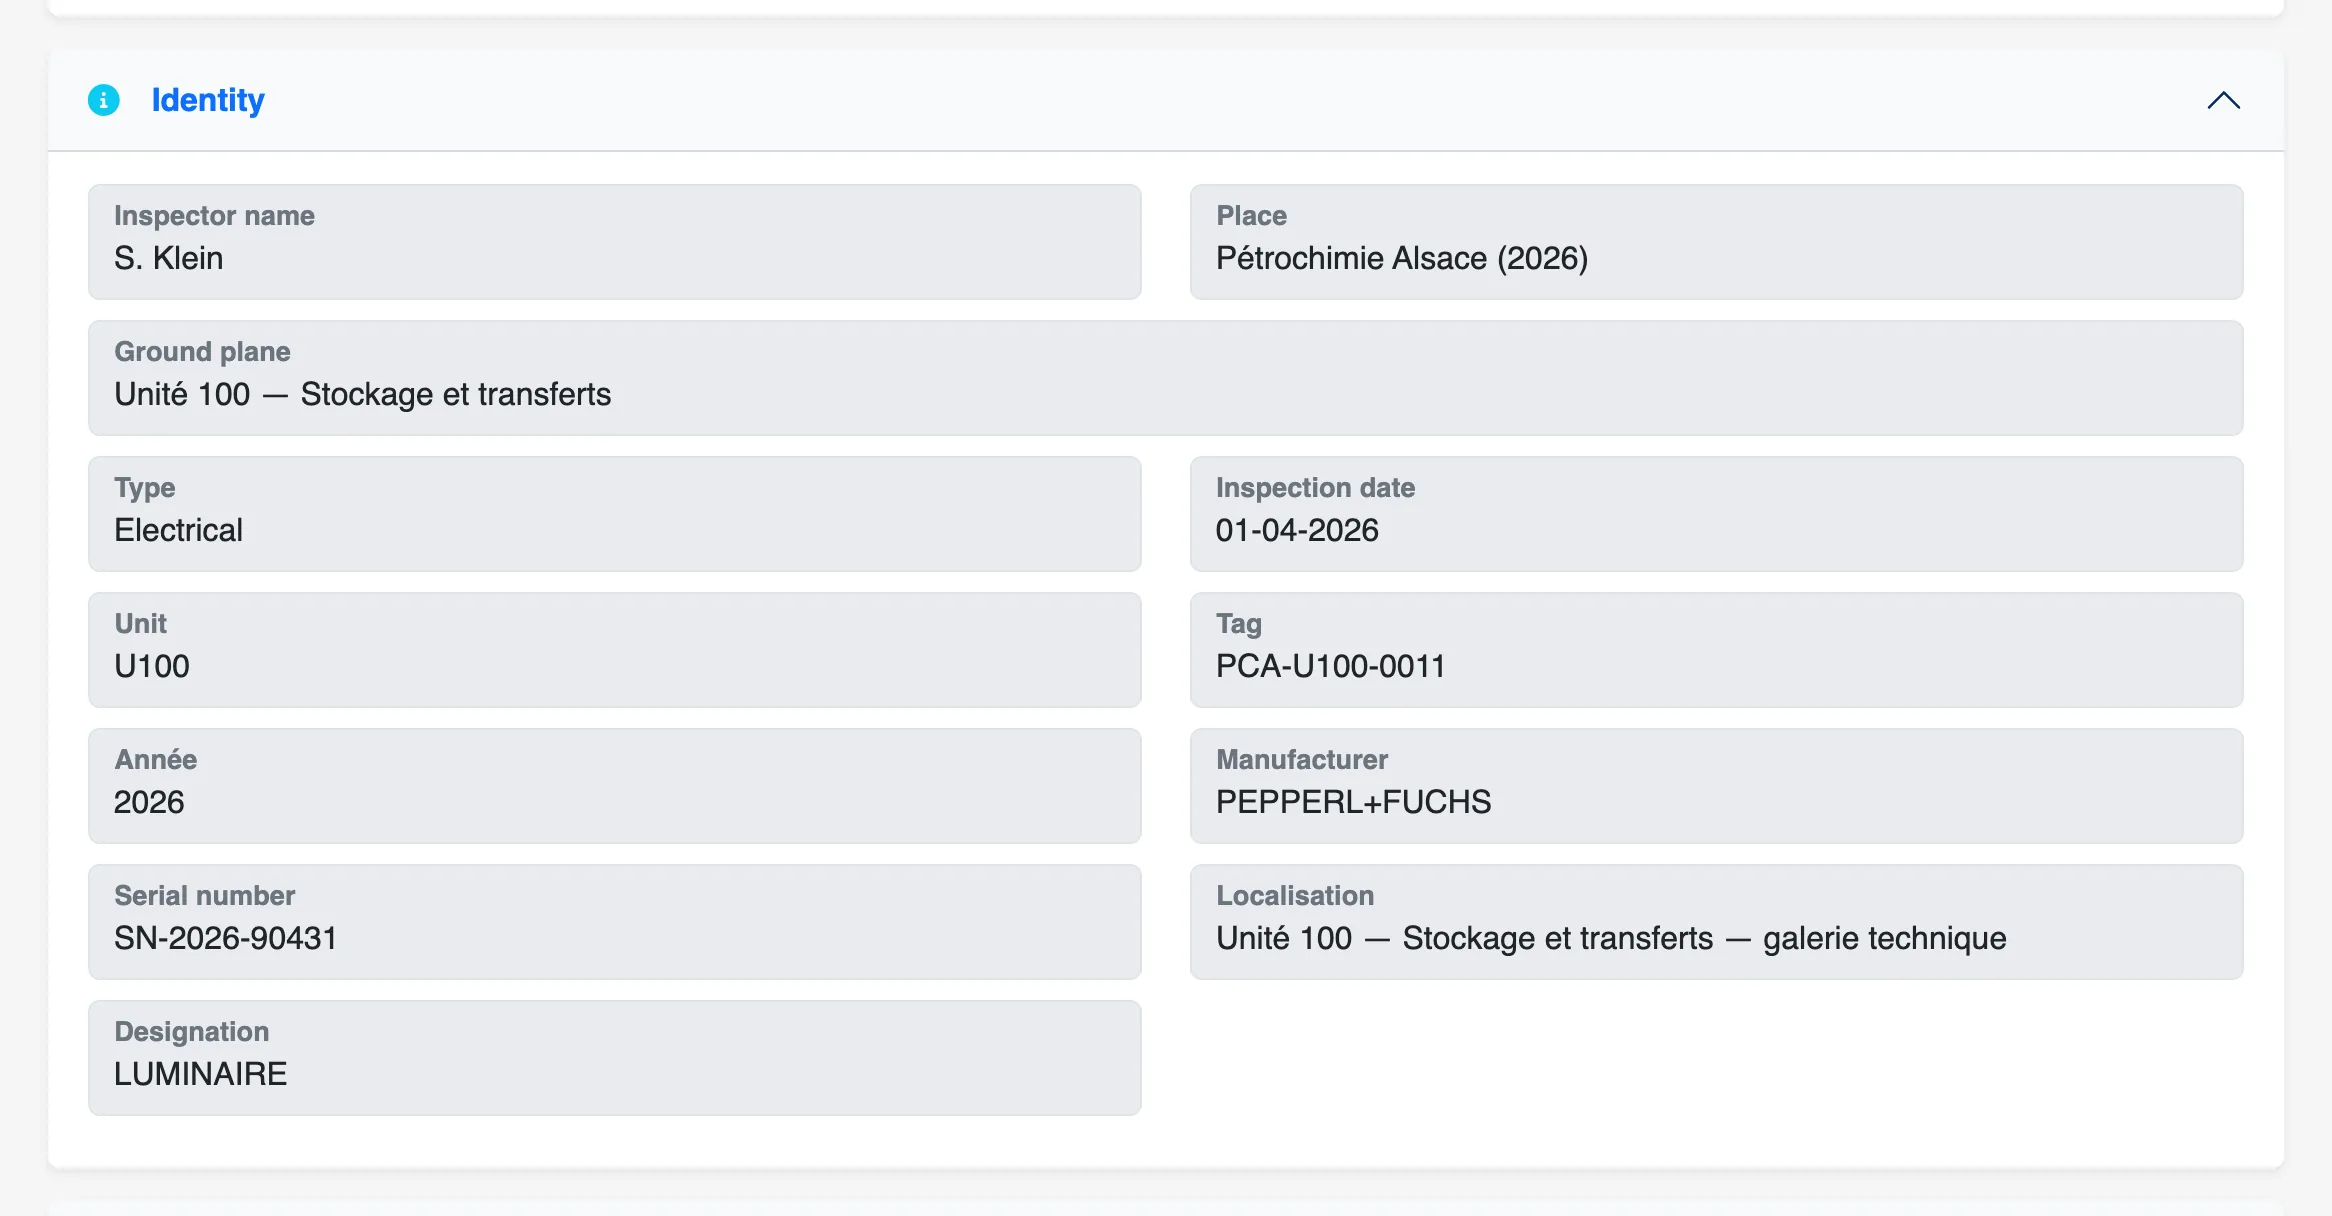
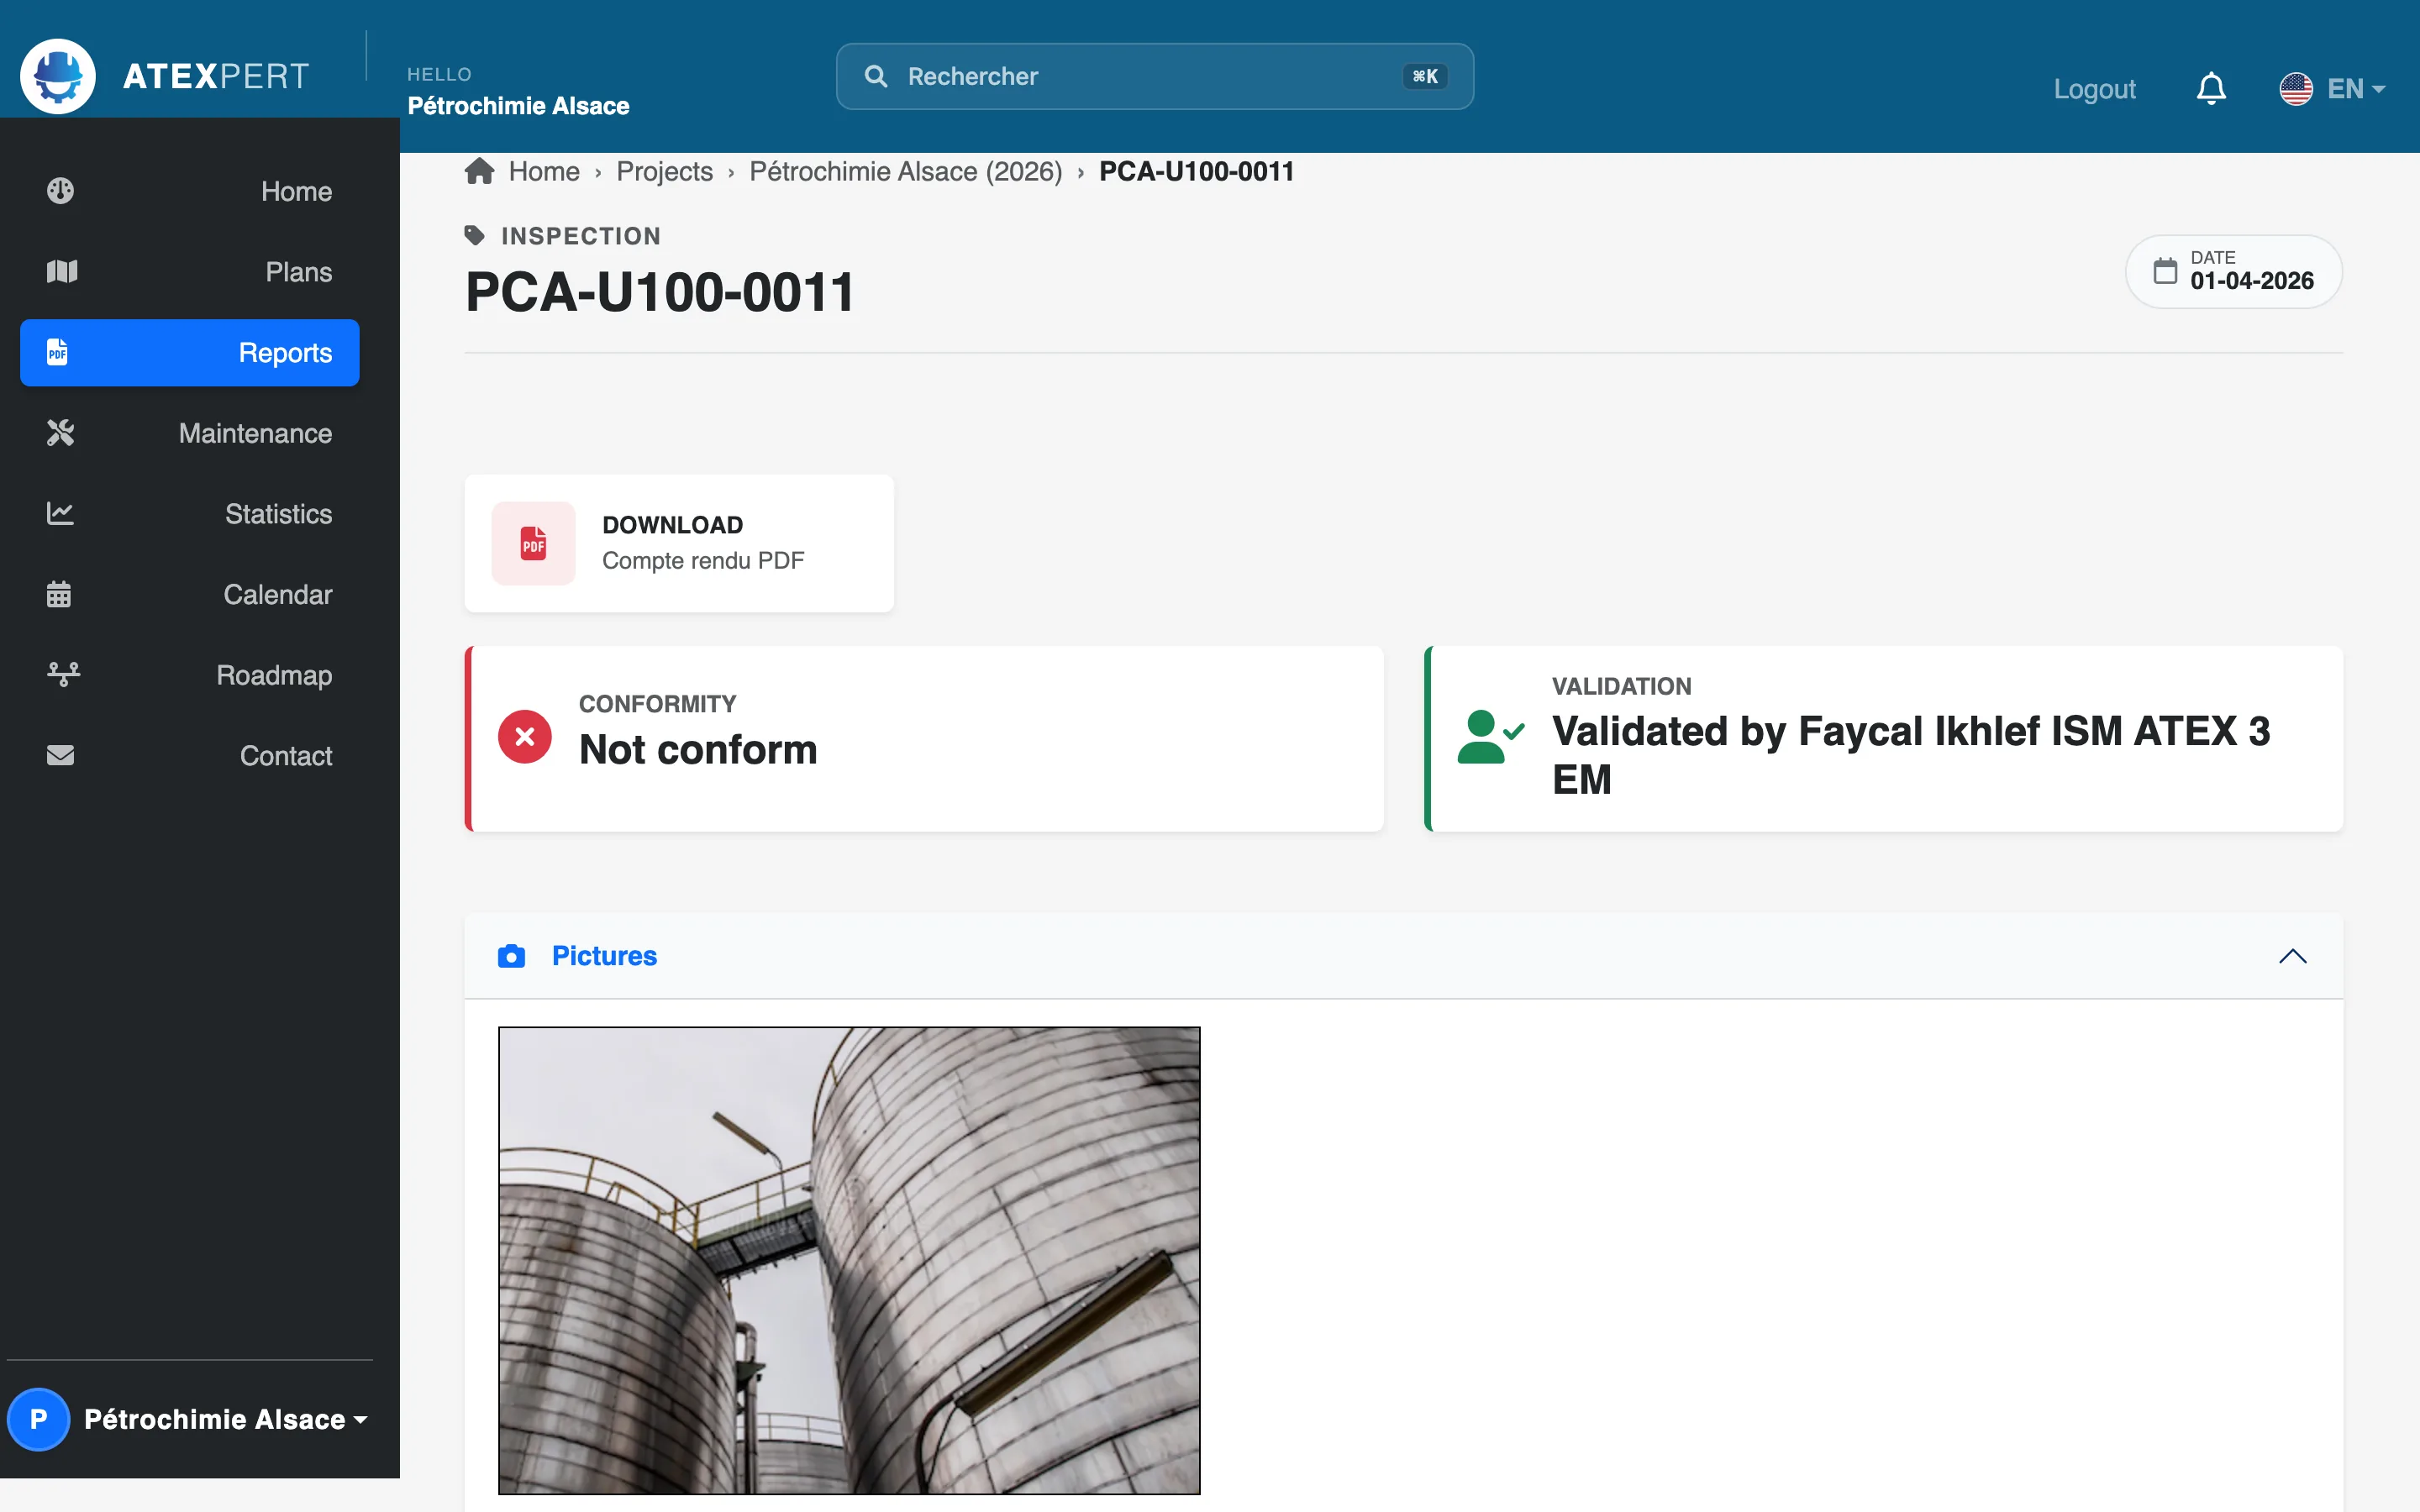
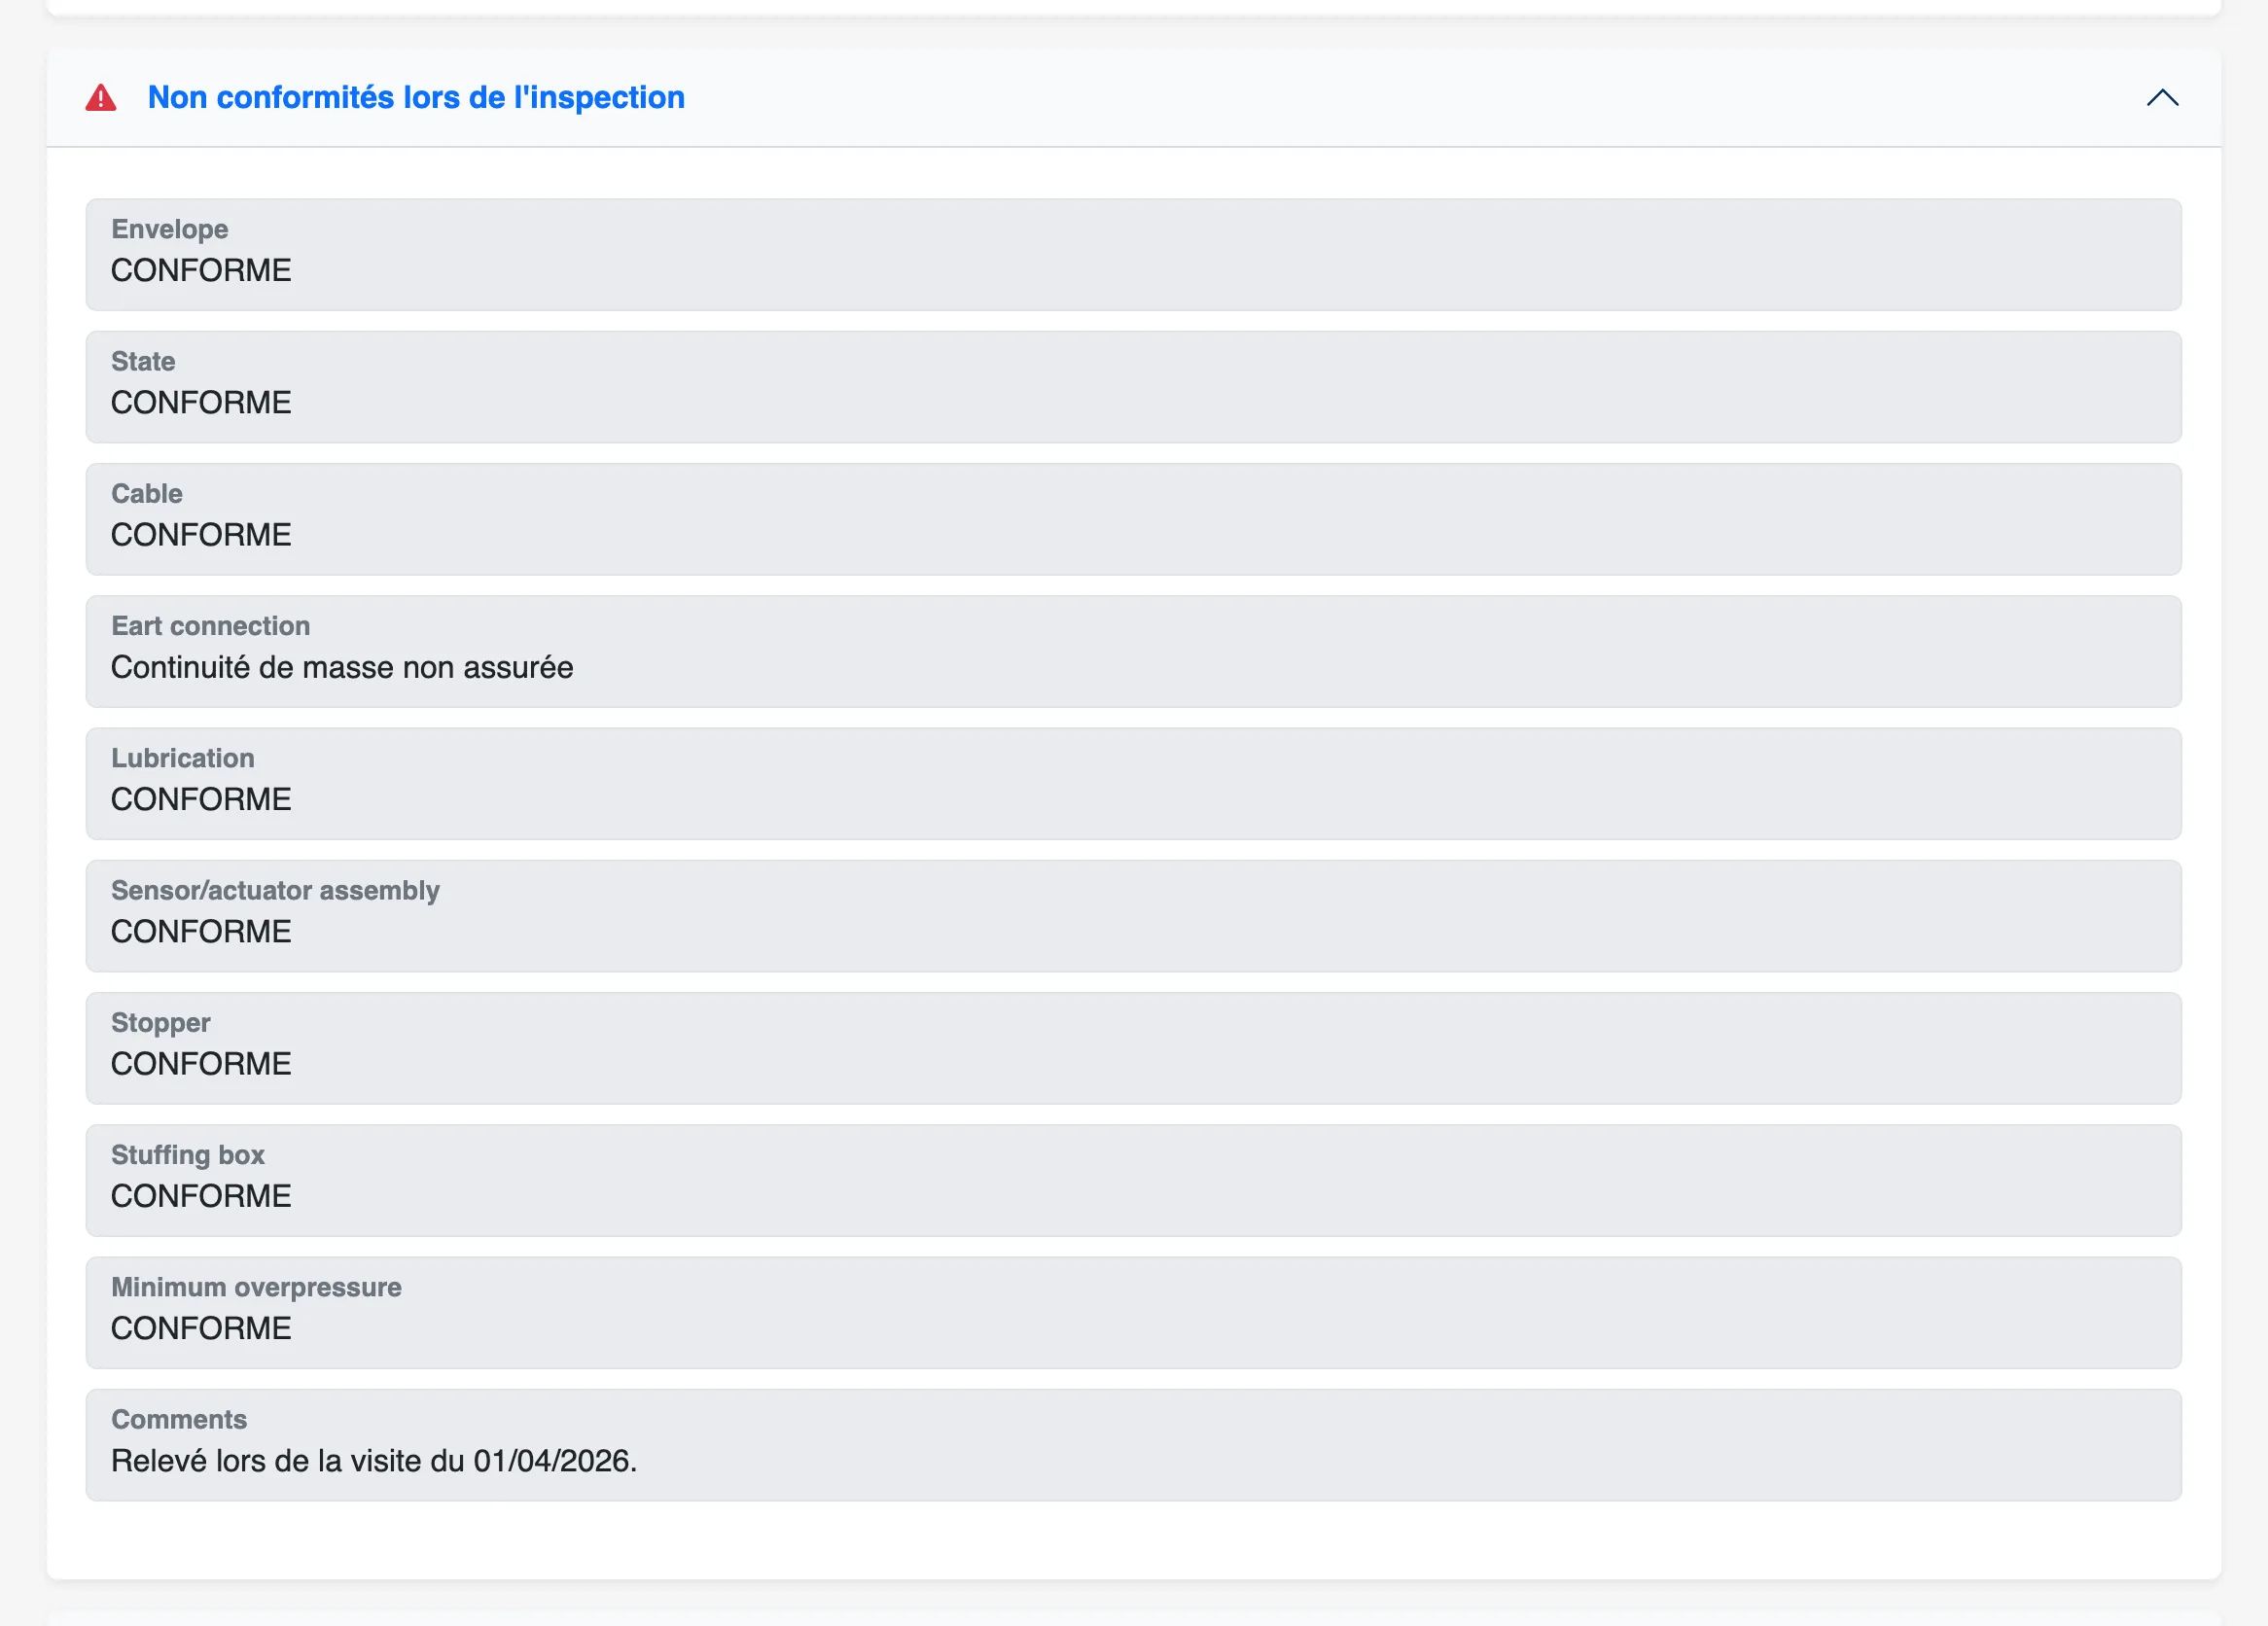
What was checked, what failed, what to do about it.
Identity, hazardous area classification, ATEX marking, certificate: the record holds the full file. Every check point is recorded individually, and each finding comes with the corrective action expected.
To decide where to start.
Statistics filter by unit, by hazardous area and by criticality. You spot the unit concentrating the major findings, and you allocate your maintenance budget on figures rather than on impressions.
By tag, unit, hazardous area or status.
The full list filters on every field of the register. A tag, a serial number, an equipment family: you find the row in seconds, years after the audit too.
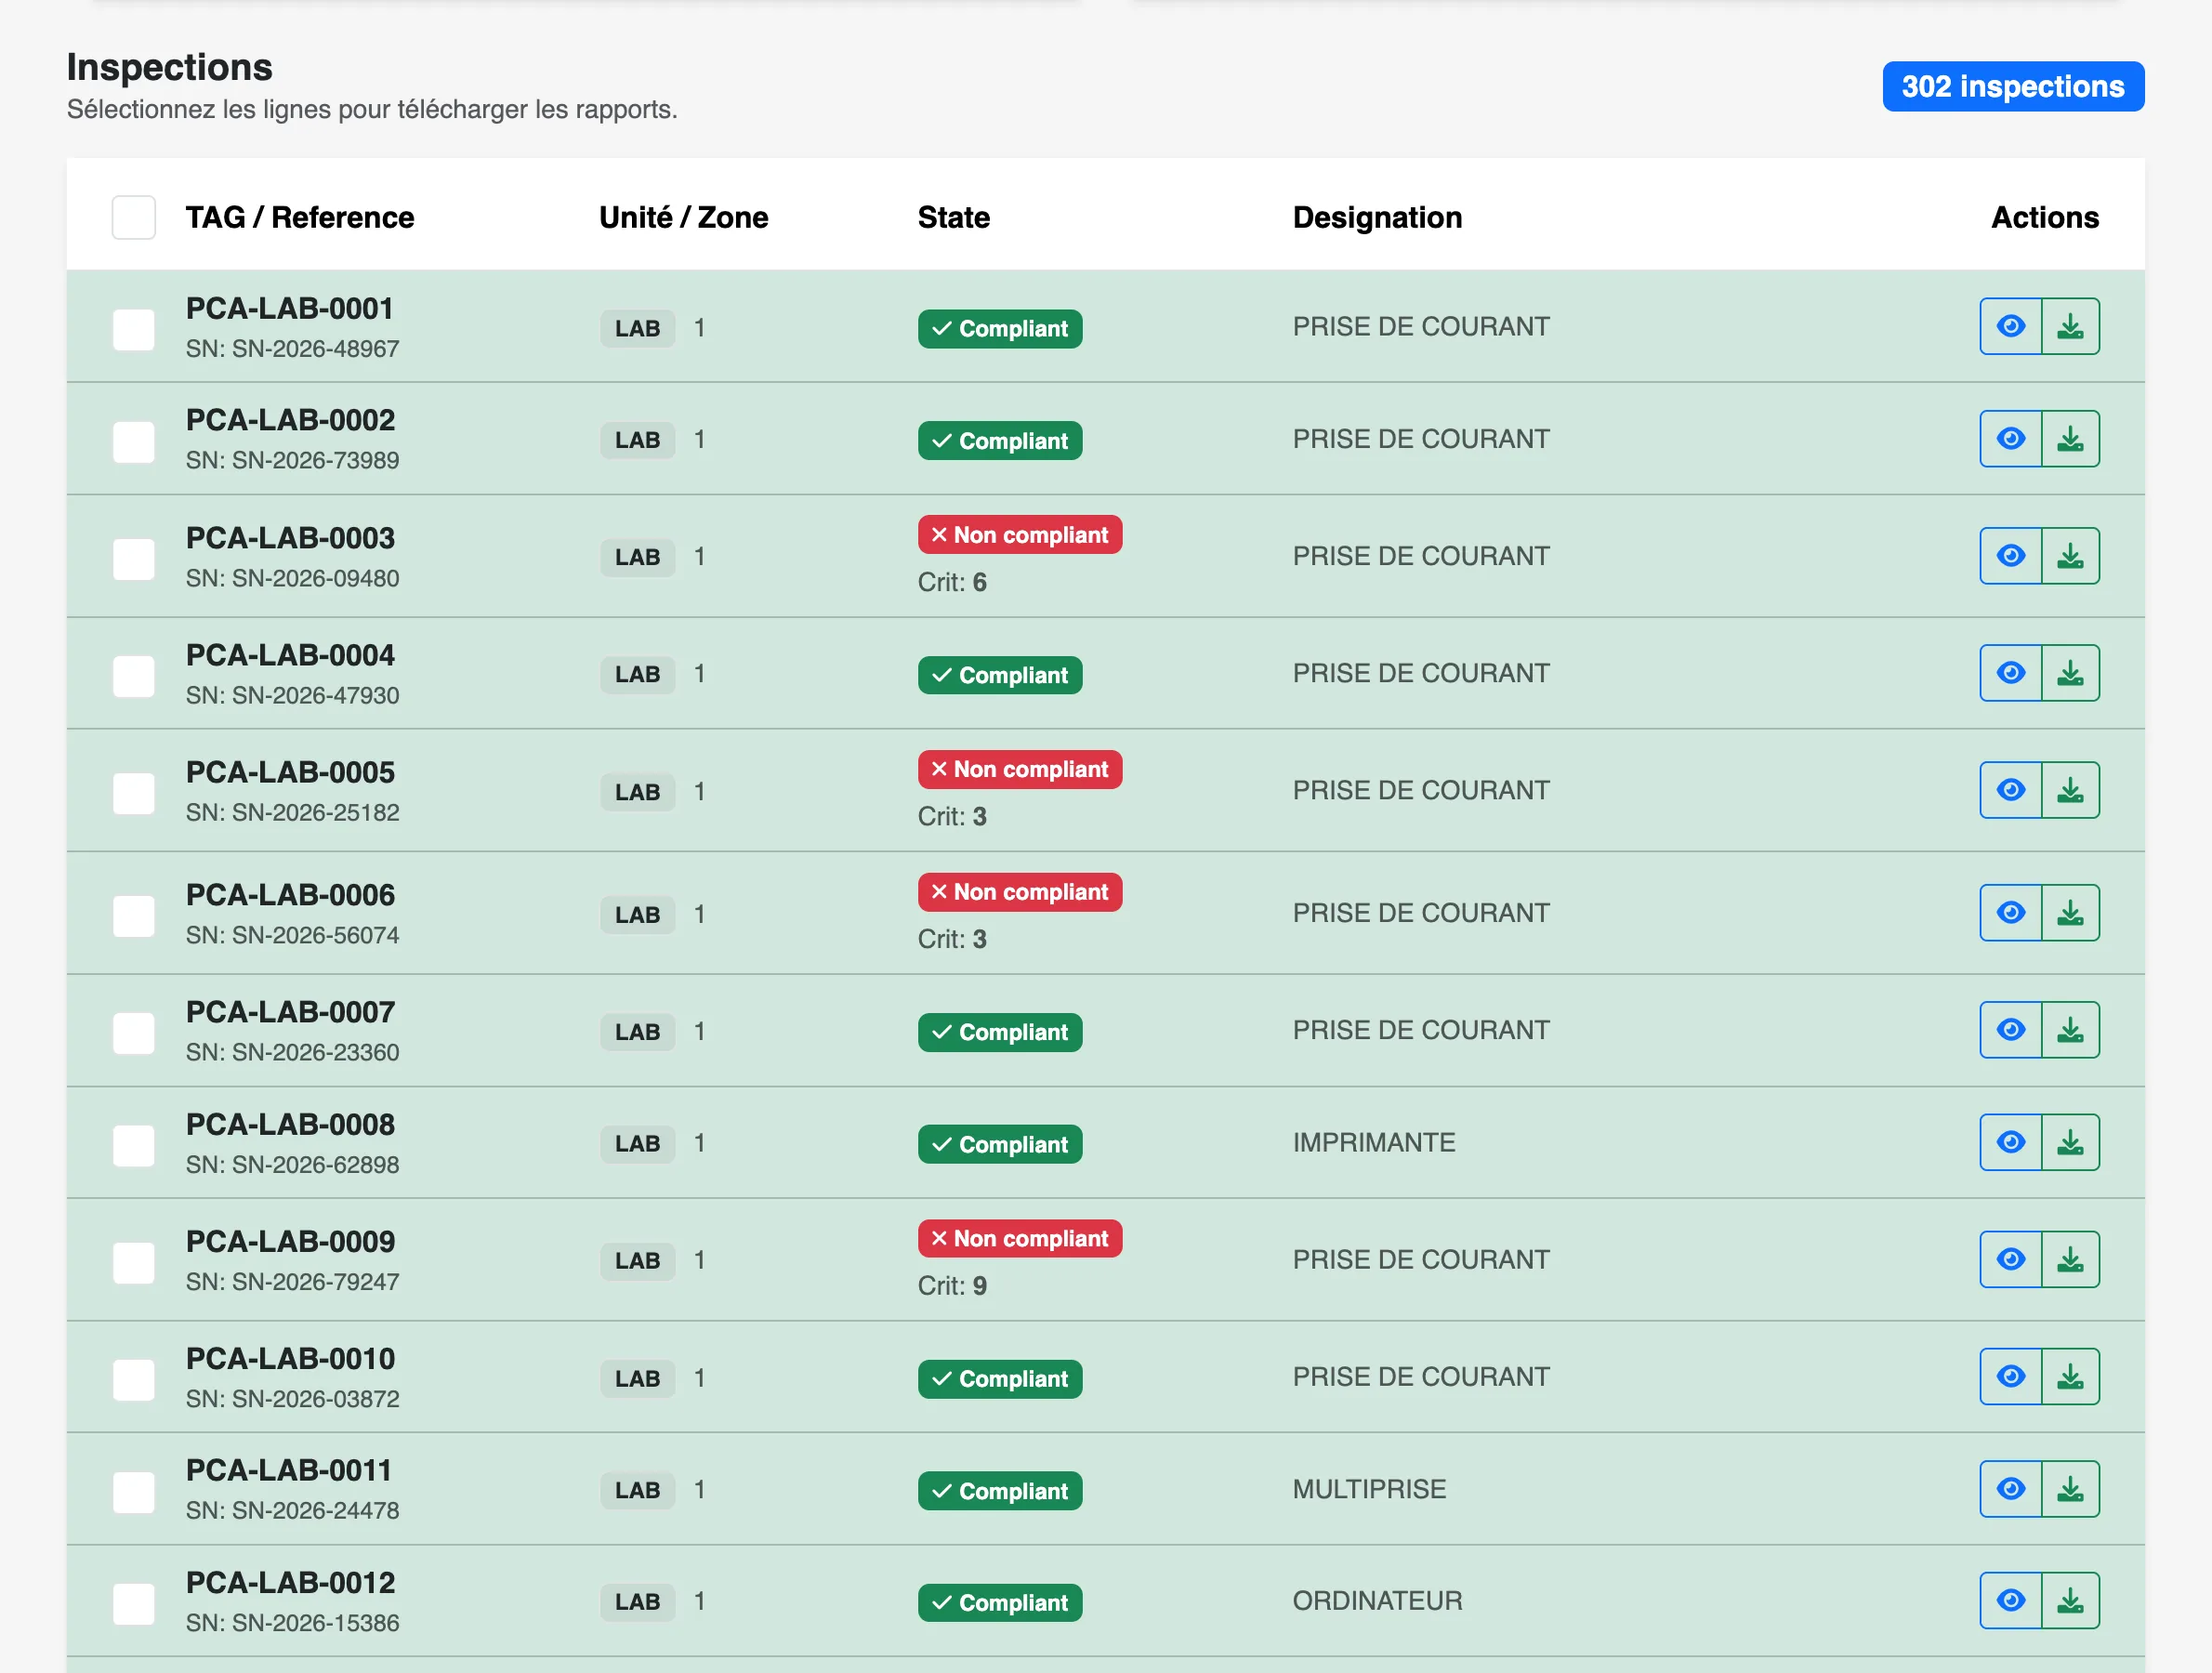
The full report, or the one line you need.
PDF report per campaign, Excel export of the register, individual equipment reports. Your data stays yours and leaves the software in formats your teams and contractors already read.
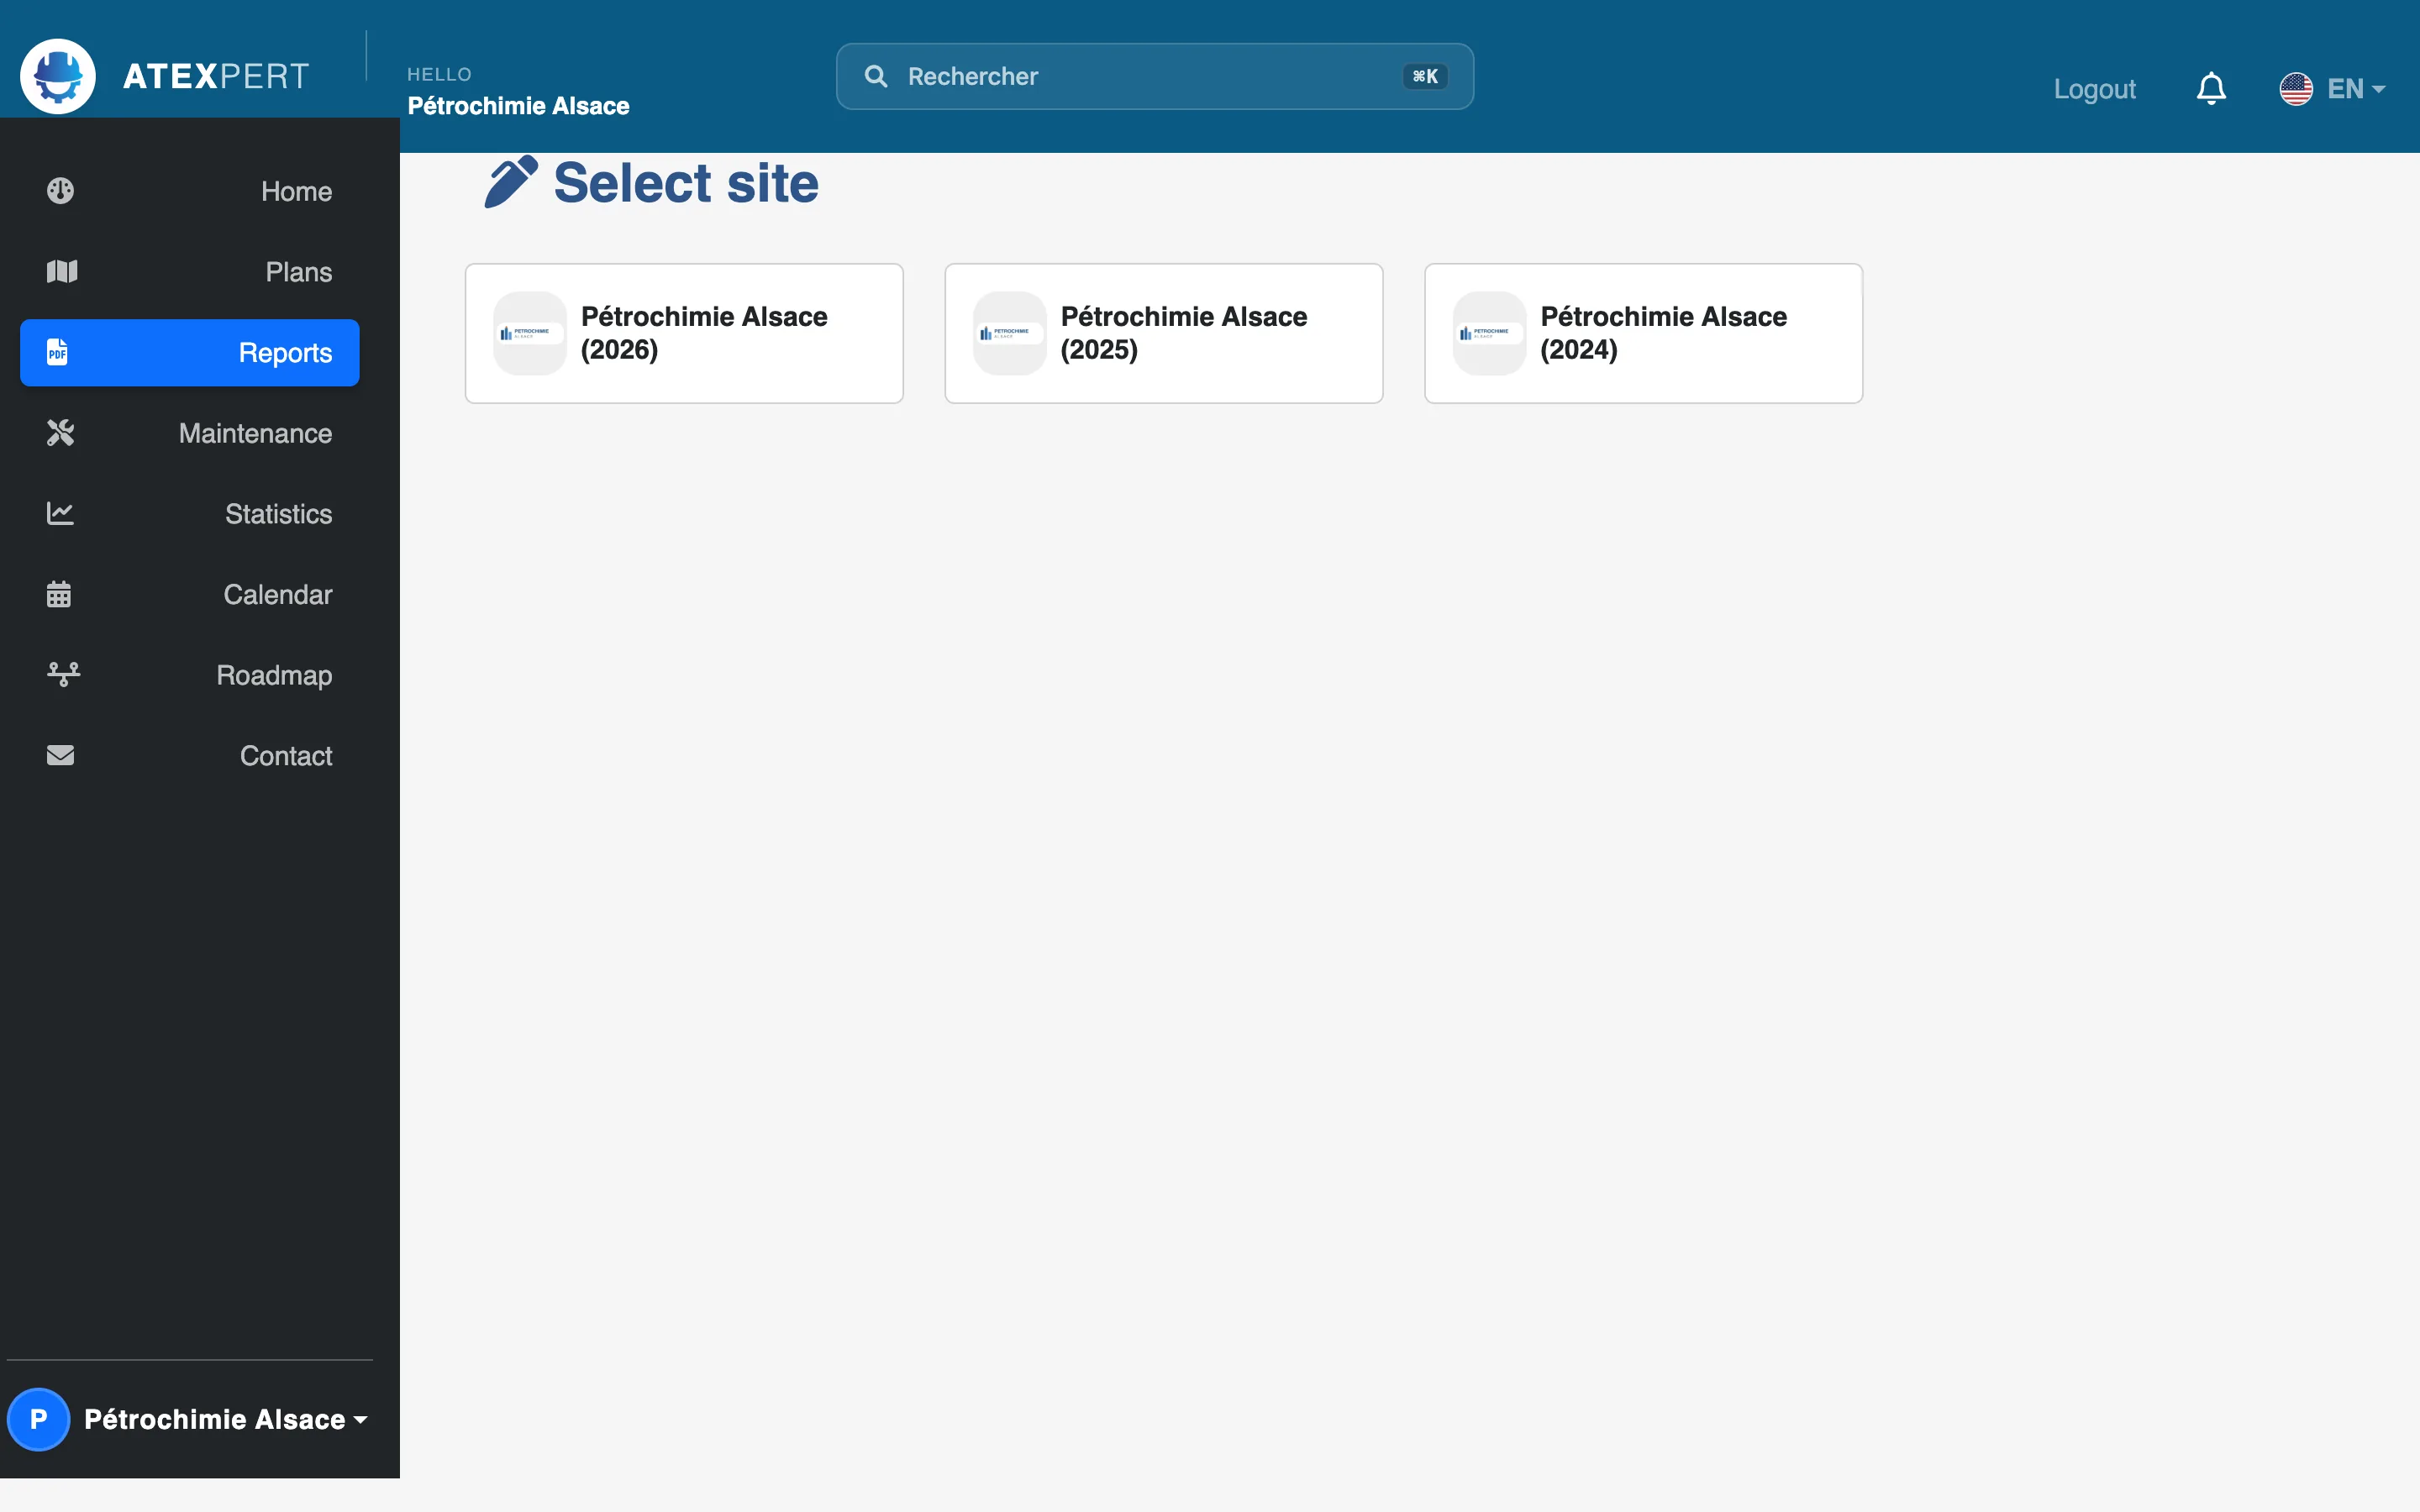
ATEXpert is used on industrial sites to track ATEX compliance campaign after campaign. Write to us: we will walk you through the software on a scope that looks like yours.
Contact us